Homepage =>> http://cmpg.unibe.ch/software/arlequin3
<가능한 분석>
The analyses Arlequin can perform on the data fall into two main categories: intra-population and inter-population methods. In the first category statistical information is extracted independently from each population, whereas in the second category, samples are compared to each other.
|
Intra-population methods: |
Short description: |
|
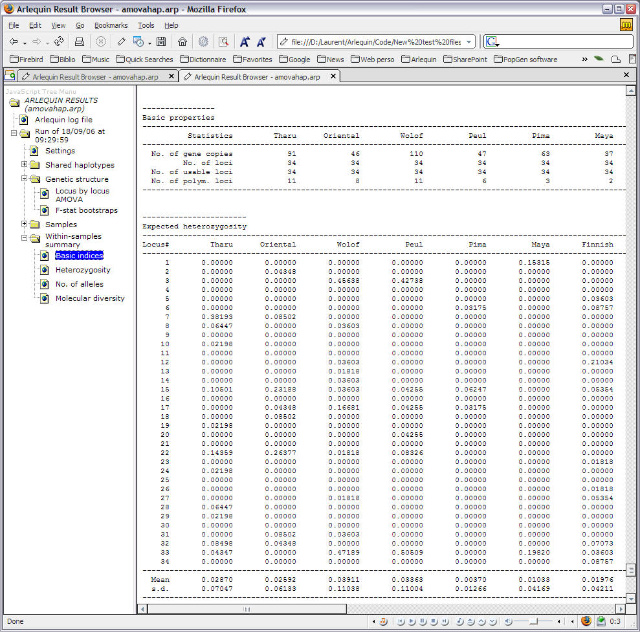
Standard indices |
Some diversity measures like the number of polymorphic sites, gene diversity. |
|
Molecular diversity |
Calculates several diversity indices like nucleotide diversity, different estimators of the population parameter q. |
|
Mismatch distribution |
The distribution of the number of pairwise differences between haplotypes, from which parameters of a demographic (NEW in ver 3.x) or spatial population expansion can be estimated |
|
Haplotype frequency estimation |
Estimates the frequency of haplotypes present in the population by maximum likelihood methods. |
|
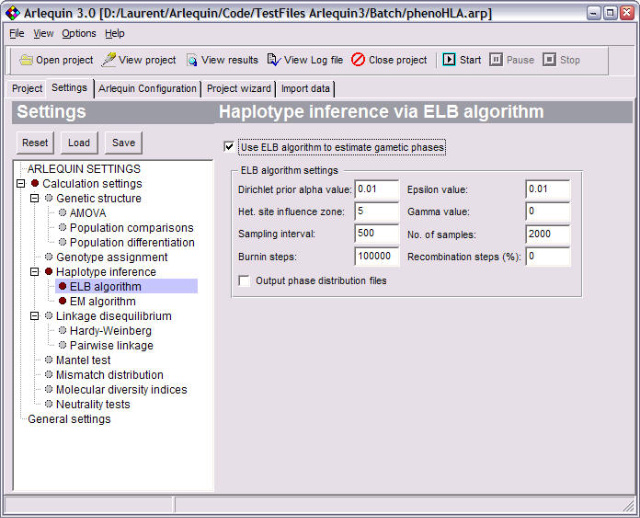
Gametic phase estimation |
Estimates the most like gametic phase of multi-locus genotypes using a pseudo-Bayesian approach (ELB algorithm). |
|
Linkage disequilibrium |
Test of non-random association of alleles at different loci. |
|
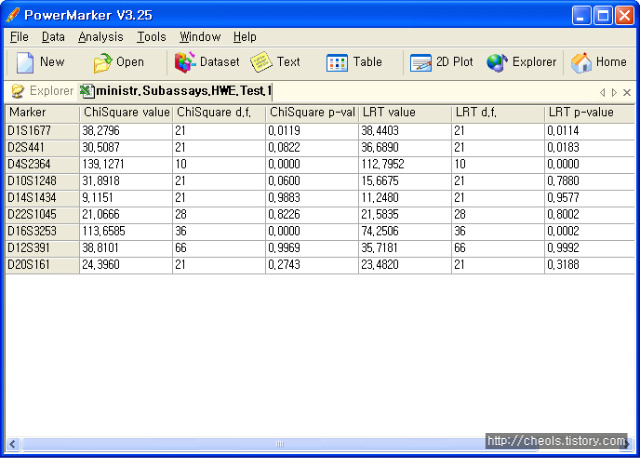
Hardy-Weinberg equilibrium |
Test of non-random association of alleles within diploid individuals. |
|
Tajima’s neutrality test |
Test of the selective neutrality of a random sample of DNA sequences or RFLP haplotypes under the infinite site model. |
|
Fu's FS neutrality test |
Test of the selective neutrality of a random sample of DNA sequences or RFLP haplotypes under the infinite site model. |
|
Ewens-Watterson neutrality test |
Tests of selective neutrality based on Ewens sampling theory under the infinite alleles model. |
|
Chakraborty’s amalgamation test |
A test of selective neutrality and population homogeneity. This test can be used when sample heterogeneity is suspected. |
|
Minimum Spanning Network (MSN) |
Computes a Minimum Spanning Tree (MST) and Network (MSN) among haplotypes. This tree can also be computed for all the haplotypes found in different populations if activated under the AMOVA section. |
|
Inter-population methods: |
Short description: |
|
Search for shared haplotypes between populations |
Comparison of population samples for their haplotypic content. All the results are then summarized in a table. |
|
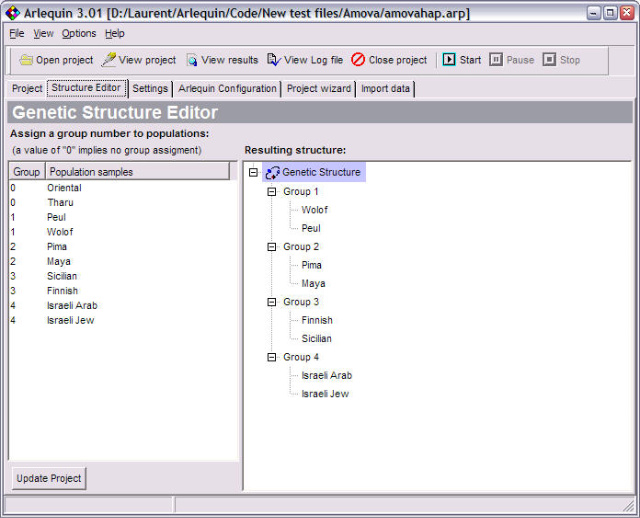
AMOVA |
Different hierarchical Analyses of Molecular Variance to evaluate the amount of population genetic structure. |
|
Pairwise genetic distances |
FST based genetic distances for short divergence time. |
|
Exact test of population differentiation |
Test of non-random distribution of haplotypes into population samples under the hypothesis of panmixia. |
|
Assignment test of genotypes |
Assignment of individual genotypes to particular populations according to estimated allele frequencies. |
|
Mantel test: |
Short description: |
|
Correlations or partial correlations between a set of 2 or 3 matrices |
Can be used to test for the presence of isolation-by-distance |
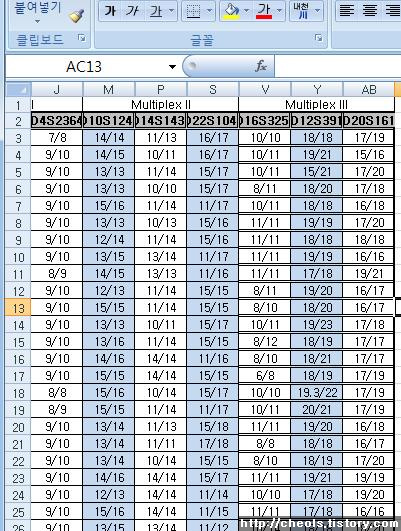
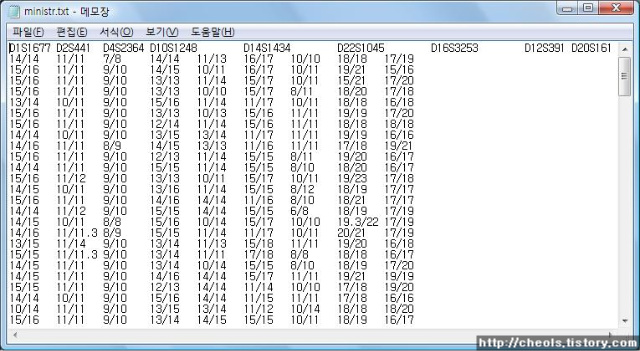
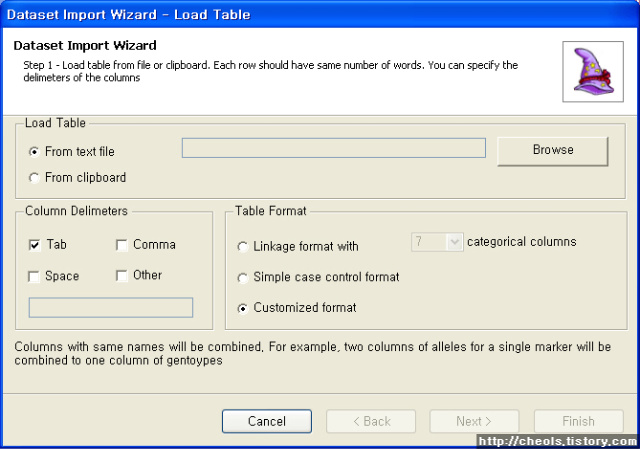
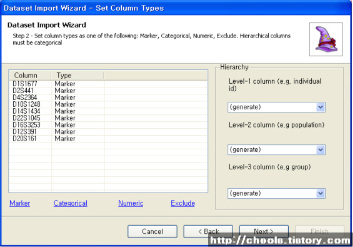
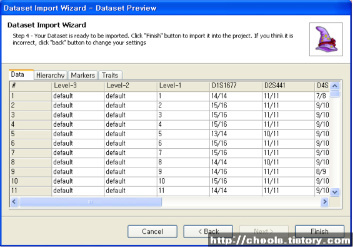
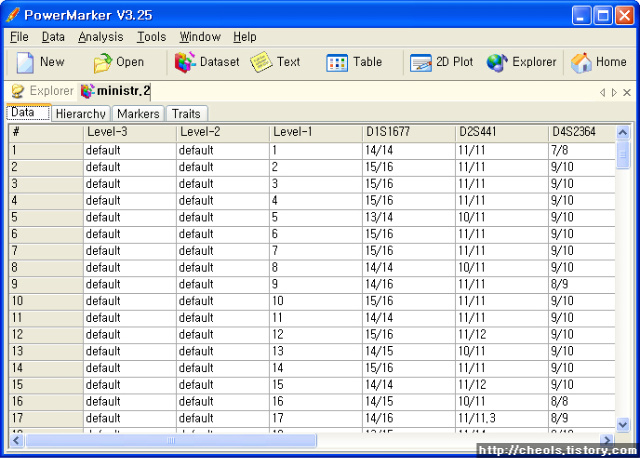
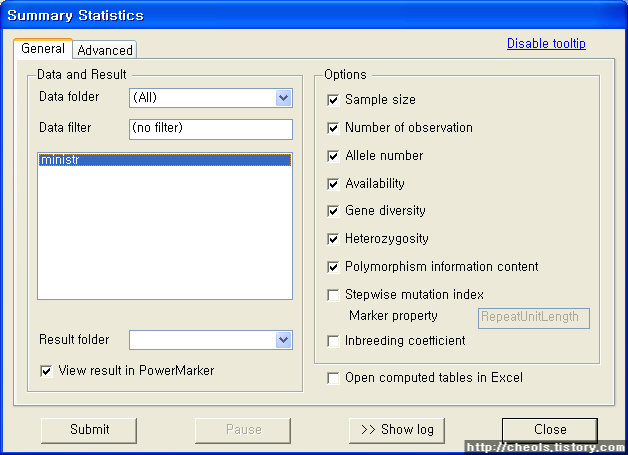
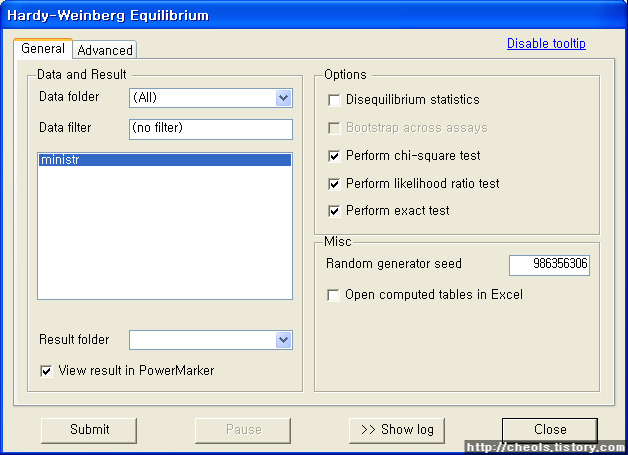
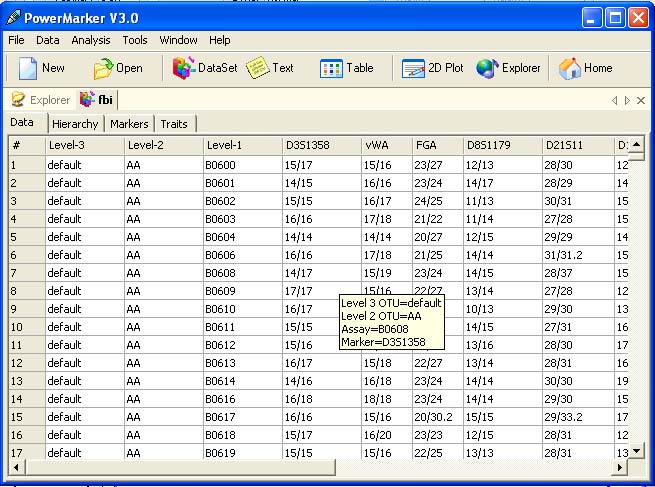
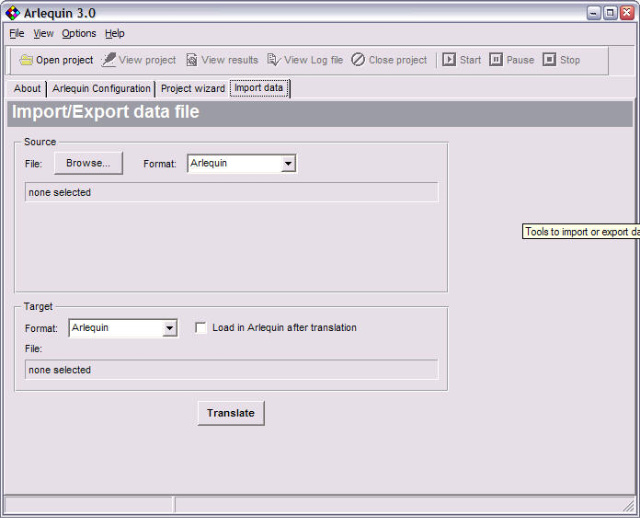
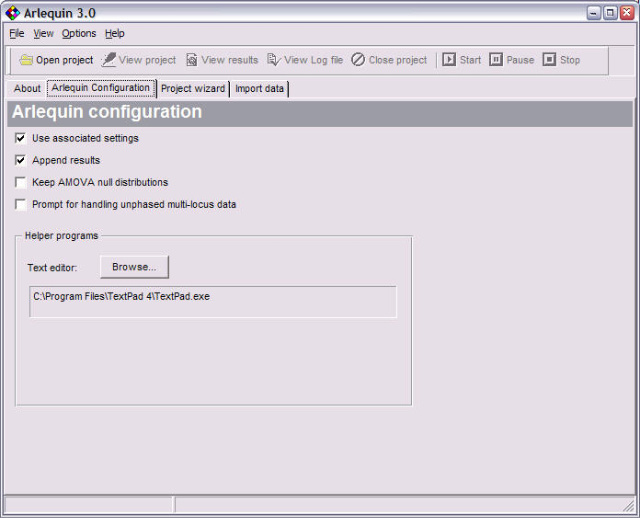
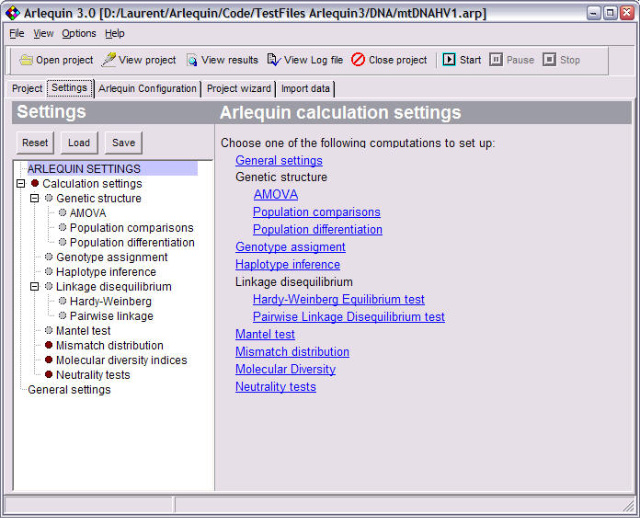
<ScreenShots>

'[BT] Population and forensics' 카테고리의 다른 글
| [펌] 한국인의 핏줄, 누구와 더 가깝나? (3) | 2010.03.15 |
|---|---|
| [JOVE] Primer Extension Capture: Targeted Sequence Retrieval from Heavily Degraded DNA Sources (0) | 2010.01.31 |
| Powermarker 를 이용한 STR 분석 (0) | 2008.06.25 |
| Population genetics data analysis program - Powermarker v3.25 (0) | 2008.06.25 |
| 제노그래픽 프로젝트 (Genographic project) (0) | 2008.01.24 |