The D-statistic was introduced in Green et al. (2010) (Neandertal admixture paper) and used in Reich et al. (2010) (Denisovan admixture paper). In basic terms it studies whether from a pair of populations P1, P2 one is closer to a third one P3, using P4 as an outgroup.

D(P1,P2,P3,P4)

In the aforementioned papers it was usually used like this:

D(Eurasian, African, Archaic, Chimpanzee)

and its positive values were interpreted as evidence of archaic admixture of different kind in subsets of modern humans (non-Africans and Melanesians).


  블로그를 구경하다가 D-statistics 라는 것을 보았습니다. 저도 처음 보는 것이라 한번 보면서 간단히 소개하고자 합니다.
  D-statistics는 2010년에 Green 등 (2010)Reich 등 (2010)에 의해 처음 소개되었습니다. 이 방법은 기본적으로 한 쌍의 집단 P1, P2 그리고 비교할 세 번째 집단 P3, outgroup(외부집단)으로 이용되는 P4 를 이용해서 조사하며, 이는 D(P1,P2,P3,P4)로 표시합니다.
  예를 들어 D(Eurasian, African, Archaic, Chimpanzee)일 때 결과값이 positive한 값이면, 현대 인류의 일부에 다른 종의 고대의 혼합이 있다는 증거로 해석할 수 있습니다.

  고대 DNA 분석을 위한 목적으로 최근에 나온 방법이며, 집단간에 혼합의 정도를 분석하는 방법중 한 가지 입니다.
  아직 처음 본거라 정확한 내용은 더 공부해야 알 듯 합니다. 추가적인 내용은 아래 출처를 참조해주세요.


- 출처 : Dienekes' Anthropology Bolg, Mol Biol Evol (2011) doi: 10.1093/molbev/msr048
Posted by 토리군
[BT]2008. 6. 25. 15:44
Y-SNP-genotyping – a new approach in forensic analysis

R. Lessiga, M. Zoledziewskac, K. Fahrb, J. Edelmanna, M. Kostrzewab, T. Doboszc, W.J. Kleemann

Forensic Science International 154 (2005) 128–136

  Y-chromosomal DNA polymorphisms, especially Y-STRs are well established in forensic routine case work. The STRs are used for identification in paternity deficiency cases and stain analysis with complicate mixtures of male and female DNA. In contrast, Y-chromosomal SNPs are a new tool in forensic investigations. At present, Y-SNPs are mainly used in molecular anthropology for evolutionary studies. Nevertheless, these markers could also provide very useful information for the analysis of forensic cases. The aim of the presented study was to test Y-SNP-typing for stain analyses using different methods—SNaPshot and MALDI-TOF MS. Both methods are based on the principle of minisequencing. The selected Y-SNP markers are suited to define the most important European haplogroups.


Forensic Sci Int. 2005 Nov 25;154(2-3):128-36. Epub 2004 Nov 23.
PMID: 16182959 [PubMed - indexed for MEDLINE]

==========

>> Y-STR은 법과학 사건 조사에서 부계 식별 또는 남성과 여성의 DNA가 섞여있을 경우에 유용하게 이용할 수 있다. STR과는 달리, Y-SNP는 법과학 조사에서 새롭게 이용되는 도구이다. 현재는 주로 인류학의 진화 연구에 이용되고 있다. 그렇지만 이들 마커는 이들은 법과학 사건 분석에도 매우 유용한 정보를 제공해 줄 수 있다. 이 연구의 목표는 다른 방법을 사용하여 흔적에 대한 Y-SNP typing 분석방법 두가지(SNaPshot 과 MALDI-TOF MS)를 테스트해보는 것이다. 두 가지 방법은 minisequencing을 기반으로 하고 있다.

==========
* genotyping of Y-SNPs using the genoSNIP assay based on MALDI-TOF MS is less time consuming.
* MALDI-TOF MS is not as widely distributed, the mass spectrometry has the disadvantage of high starting costs so far.
* Y-SNPs correctly also in samples containing less than 125pg DNA.
* High amount of female DNA did not disturb the PCR reaction of the male part.
* detection of the haplogroups can give additional information in the routine of criminalistics to identify an unknown body or perpetrator.

* A special advantage of the SNPs is the very short length of the fragments, what is very important in particular for the analysis of degraded DNA.

'[BT]' 카테고리의 다른 글

Transcription and Translation 동영상  (0) 2008.07.01
The Inner Life of The Cell  (0) 2008.07.01
DNA (Deoxyribonucleic acid)  (0) 2008.07.01
DNA sequencing 의 두 가지 방법  (0) 2008.06.26
PCR song  (0) 2008.01.24
Posted by 토리군
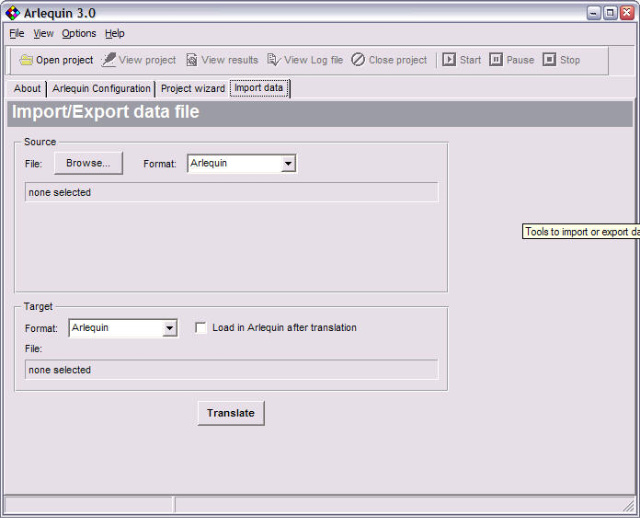
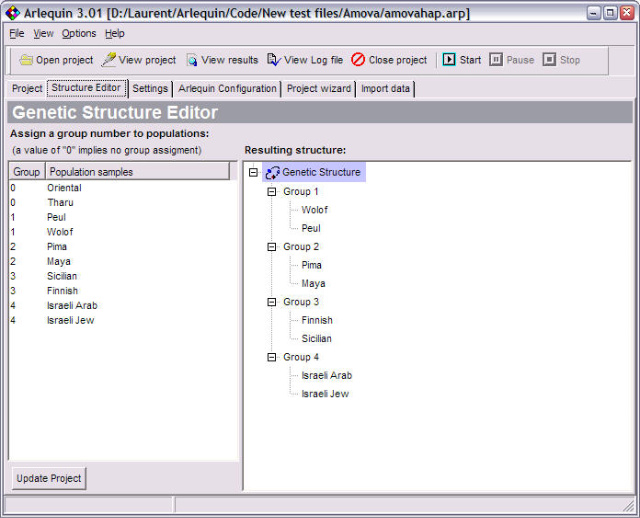
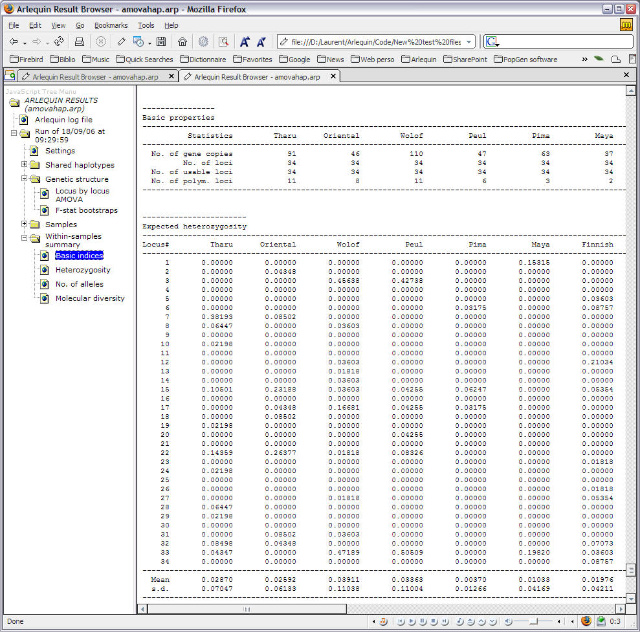
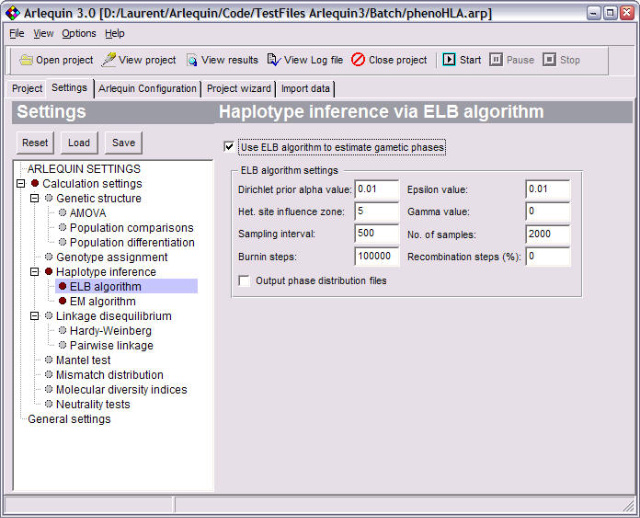
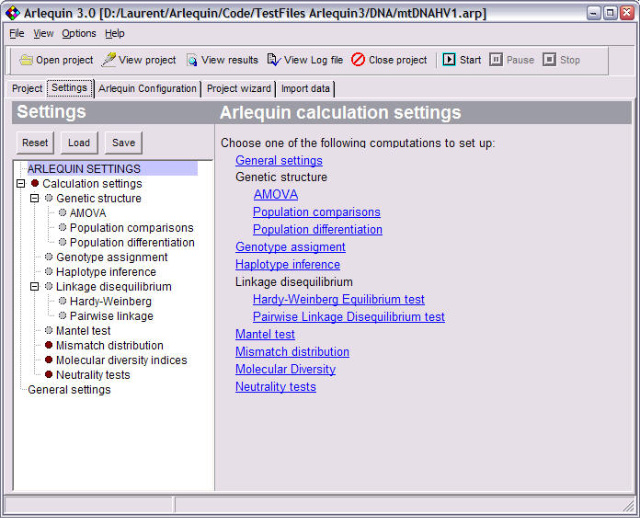
Population Genetics statistical program
Arlequin 3.11 (download) & manual download

Homepage =>> http://cmpg.unibe.ch/software/arlequin3


<가능한 분석>
  The analyses Arlequin can perform on the data fall into two main categories: intra-population and inter-population methods. In the first category statistical information is extracted independently from each population, whereas in the second category, samples are compared to each other.

Intra-population methods:

Short description:

Standard indices

Some diversity measures like the number of polymorphic sites, gene diversity.

Molecular diversity

Calculates several diversity indices like nucleotide diversity, different estimators of the population parameter q.

Mismatch distribution

The distribution of the number of pairwise differences between haplotypes, from which parameters of a demographic (NEW in ver 3.x) or spatial population expansion can be estimated

Haplotype frequency estimation

Estimates the frequency of haplotypes present in the population by maximum likelihood methods.

Gametic phase estimation
(NEW in ver 3.x)

Estimates the most like gametic phase of multi-locus genotypes using a pseudo-Bayesian approach (ELB algorithm).

Linkage disequilibrium

Test of non-random association of alleles at different loci.

Hardy-Weinberg equilibrium

Test of non-random association of alleles within diploid individuals.

Tajima’s neutrality test

Test of the selective neutrality of a random sample of DNA sequences or RFLP haplotypes under the infinite site model.

Fu's FS neutrality test

Test of the selective neutrality of a random sample of DNA sequences or RFLP haplotypes under the infinite site model.

Ewens-Watterson neutrality test

Tests of selective neutrality based on Ewens sampling theory under the infinite alleles model.

Chakraborty’s amalgamation test

A test of selective neutrality and population homogeneity. This test can be used when sample heterogeneity is suspected.

Minimum Spanning Network (MSN)

Computes a Minimum Spanning Tree (MST) and Network (MSN) among haplotypes. This tree can also be computed for all the haplotypes found in different populations if activated under the AMOVA section.


Inter-population methods:

Short description:

Search for shared haplotypes between populations

Comparison of population samples for their haplotypic content. All the results are then summarized in a table.

AMOVA

Different hierarchical Analyses of Molecular Variance to evaluate the amount of population genetic structure.

Pairwise genetic distances

FST based genetic distances for short divergence time.

Exact test of population differentiation

Test of non-random distribution of haplotypes into population samples under the hypothesis of panmixia.

Assignment test of genotypes

Assignment of individual genotypes to particular populations according to estimated allele frequencies.


Mantel test:

Short description:

Correlations or partial correlations between a set of 2 or 3 matrices

Can be used to test for the presence of isolation-by-distance


<ScreenShots>
사용자 삽입 이미지
사용자 삽입 이미지
사용자 삽입 이미지
사용자 삽입 이미지
사용자 삽입 이미지
사용자 삽입 이미지
사용자 삽입 이미지

Posted by 토리군
이 프로그램은 사용이 쉬운 편이다.

여기서는 STR 분석을 예로 설명해 보았다.

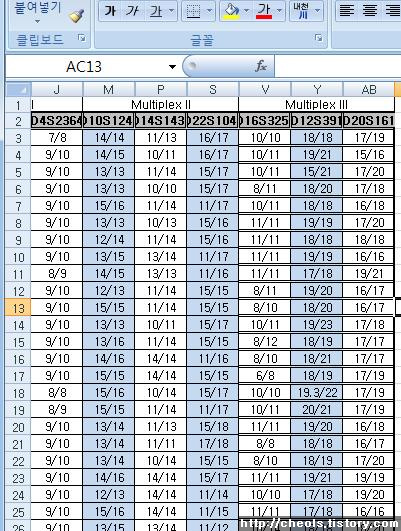
먼저 분석된 데이터를 엑셀에서 아래와 같은 양식으로 데이타를 정리한다.
사용자 삽입 이미지
* 두 allele을 따로따로 입력했을 경우,
CONCATENATE 함수를 이용하면 쉽게 두 문자를 합쳐서 위 양식을 만들 수 있다.
(각 marker의 두 allele은 / 으로 구분한다.)

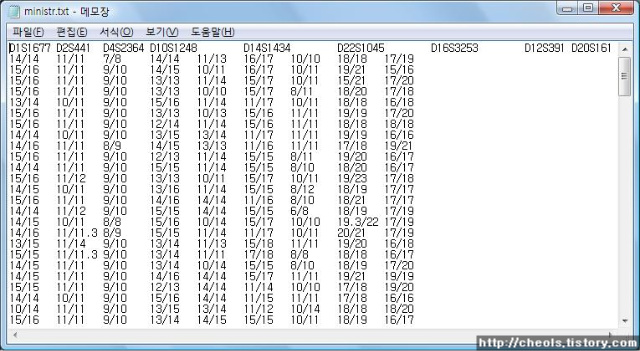
위 양식을 복사해서 txt 파일을 만든다.
사용자 삽입 이미지
제일 윗줄에는 marker 이름, 아래에는 각 marker의 allele을 적는다. marker 사이는 tab으로 띄워준다.
(엑셀에서 복사하면 tab으로 띄워져 있으니 그냥 두면 된다.)

Powermarker를 실행한다.
사용자 삽입 이미지
Project가 없을경우, Project를 생성한다. 명칭은 원하는대로...

그리고 Dataset을 클릭한다.
사용자 삽입 이미지
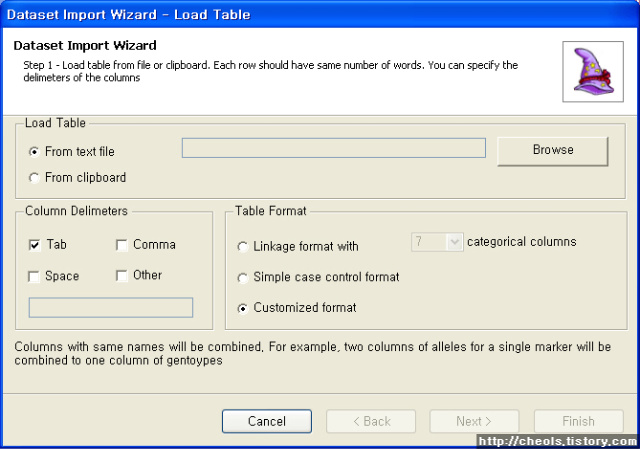
Browse를 클릭해서 이전에 만든 텍스트 파일을 불러온다. 그리고 Next

사용자 삽입 이미지
사용자 삽입 이미지

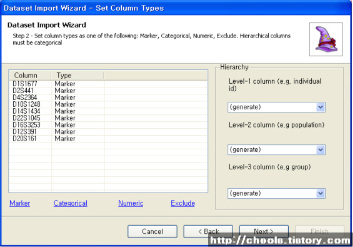
제일 윗줄을 기준으로, 각 라인이 marker인지, category인지 등을 지정한다. Next..
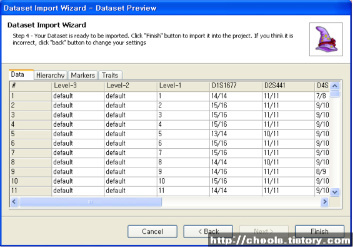
최종적으로 입력된 데이터가 나온다. Finish.

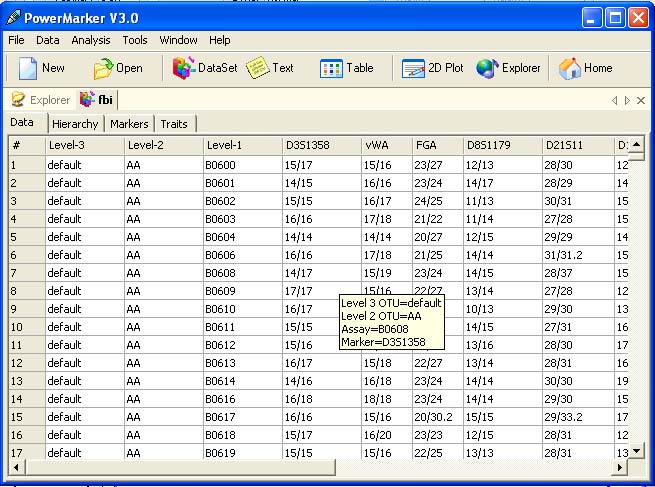
이렇게 데이터가 입력된다.
사용자 삽입 이미지


이제 분석...
메뉴의 Analysis 에서 원하는 분석방법을 선택한다.
사용자 삽입 이미지


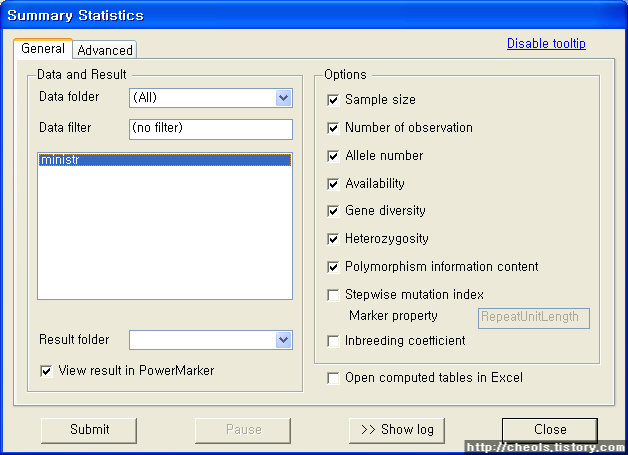
먼저 Summary Statistics를 들어가보면,
사용자 삽입 이미지

이렇게 나온다. Option에서 원하는 분석을 선택한다.
그리고 왼쪽의 Data and Result의 목록에서 아까 입력한 데이터를 선택.
Submit을 클릭하면 분석이 시작되고 결과가 나타난다.

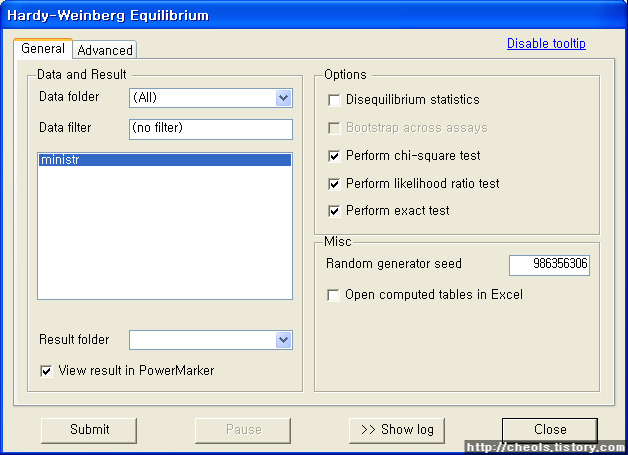
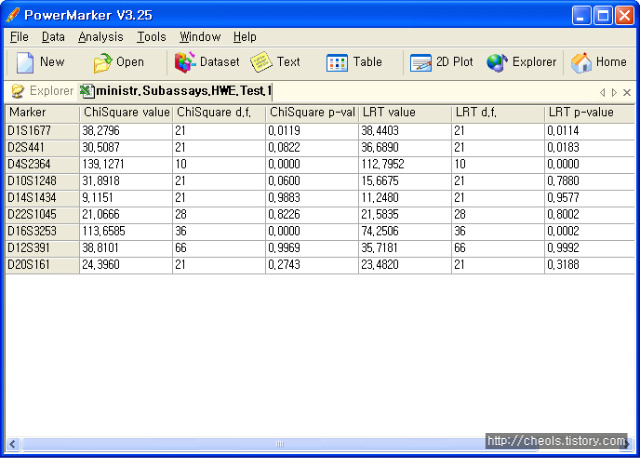
아래는 Hardy Weinberg test 분석의 경우...
사용자 삽입 이미지

마찬가지로, 원하는 분석을 선택하고 데이터를 선택하고 Submit. 하면...

아래처럼 결과가 출력된다.
사용자 삽입 이미지

이 결과는 본문의 셀을 클릭하거나,
Explorer 창에서 오른쪽 클릭후 Excel로 열기를 선택하면 Excel로 변환할 수 있다.

Posted by 토리군
집단유전학 통계 프로그램(Population genetics data analysis program)
Powermarker  v3.25 (download)  &  manual download
(.Net framework 1.1 must installed)

Homepage =>> http://statgen.ncsu.edu/powermarker/index.html


<가능한 분석 목록>
Summary statistics
  • Compute sample size
  • Compute number of observation
  • Compute allele number
  • Compute availability (1 - missing proportion)
  • Compute gene diversity using biased or unbiased version
  • Compute polymorphism information content
  • Compute heterozygosity
  • Compute stepwise mutation index which was defined as the maximal proportion of alleles which follow stepwise mutation pattern
  • Compute moment estimator or maximum likelihood estimator of within-population inbreeding coefficient
  • Summarize result at any level
  • Bootstrap across loci to estimate confidence intervals
  • Estimate allele frequency and its variance
  • Bootstrap across individual to estimate confidence interval
  • Estimate genotype frequency and allele covariance
  • Bootstrap across individual to estimate confidence interval
  • Estimate haplotype frequency using EM algorithm
  • Estimate haplotype frequency using BisectionEM algorithm
  • Estimate haplotype frequency using TrioEM algorithm
  • Assign haplotype probabilities for each individual
  • Test Hardy-Weinberg equilibrium by ChiSquare test
  • Test Hardy-Weinberg equilibrium by likelihood ratio test
  • Test Hardy-Weinberg equilibrium by Exact test
  • Compute Hardy-Weinberg disequilibrium statistics
  • Bootstrap across individual to estimate confidence interval for Hardy-Weinberg disequilibrium statistics
  • Estimate linkage disequilibrium D
  • Estimate D'
  • Estimate RSquare
  • Estimate population attributable risk
  • Estimate proportional difference
  • Estimate Yule's Q
  • Estimate two-loci haplotype frequency for computing LD statistics
  • Test two-loci linkage equilibrium by ChiSquare test
  • Test two-loci linkage equilibrium by Exact test
  • Test multi-loci linkage equilibrium by Exact test
  • Prepare 2D matrix for 2D plot
Population structure
  • Estimate population structure with admixture
  • Estimate population structure without admixture
  • Estimate classic coancestry matrix
  • Estimate population specific coancestry matrix
  • Estimate classic two-level F-statistics assuming Hardy-Weinberg equilibrium
  • Estimate classic two-level F-statistics considering inbreeding
  • Estimate classic three-level F-statistics assuming Hardy-Weinberg equilibrium
  • Estimate classic three-level F-statistics considering inbreeding
  • Estimate population specific two-level F-statistics assuming Hardy-Weinberg equilibrium
  • Estimate population specific two-level F-statistics considering inbreeding
  • Bootstrap across loci to estimate confidence interval
Phylogenetic analysis
  • Estimate frequency from DataSet
  • Estimate distance based Frequency data using 19 different methods
  • Construct UPGMA tree
  • Construct NJ tree
  • Bootstrap across loci to construct multiple trees for tree consensus
Association study
  • Allele test
  • Genotype test
  • Trend test
  • Distance test
  • Exact test
  • Genotype based F-test
  • Haplotype trend regression for binary and quantitative traits
Design
  • Choose core set of lines by allele number, allelic diversity, allelic entropy. Selection can be done with simulated annealing, random search or exhaustive search under general constrains
  • Choose haplotype tagging markers from haplotype data
  • Choose haplotype tagging markers from genotype data
  • Choose haplotype tagging markers from trio data
Tools
  • Mantel test
  • Contigency table analysis
  • SNP identification from sequences
  • Parse Structure's result
  • SNP simulation under coalescence model
  • SNP simulation under coalescence model with recombination hotspots


<ScreenShots>

사용자 삽입 이미지
사용자 삽입 이미지


Posted by 토리군