동영상과 함께 설명해주는 실험방법... http://www.jove.com
요즘 좋은거 많이 나온다.ㅋㅋ
아래는 고인골에서 추출한 DNA에서 서열확인을 위해서, 원하는 DNA를 선택적으로 분리하는 실험방법에 대한 설명
* Link : http://www.jove.com/index/details.stp?id=1573
* ABSTRACT : We present a method of targeted DNA sequence retrieval from DNA sources which are heavily degraded and contaminated with microbial DNA, as is typical of ancient bones. The method greatly reduces sample destruction and sequencing demands relative to direct PCR or shotgun sequencing approaches. We used this method to reconstruct the complete mitochondrial DNA (mtDNA) genomes of five Neandertals from across their geographic range. The mtDNA genetic diversity of the late Neandertals was approximately three times lower than that of contemporary modern humans. Together with analyses of mtDNA protein evolution, these data suggest that the long-term effective population size of Neandertals was smaller than that of modern humans and extant great apes.
'[BT] Population and forensics' 카테고리의 다른 글
| DNA 프로파일링 (DNA profiling) (0) | 2011.04.05 |
|---|---|
| [펌] 한국인의 핏줄, 누구와 더 가깝나? (3) | 2010.03.15 |
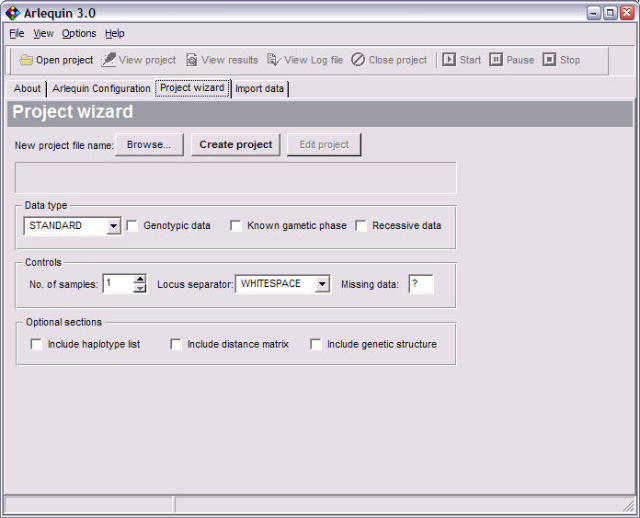
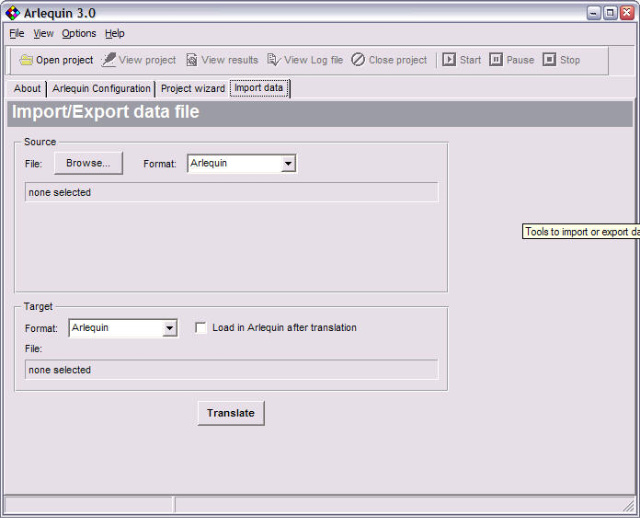
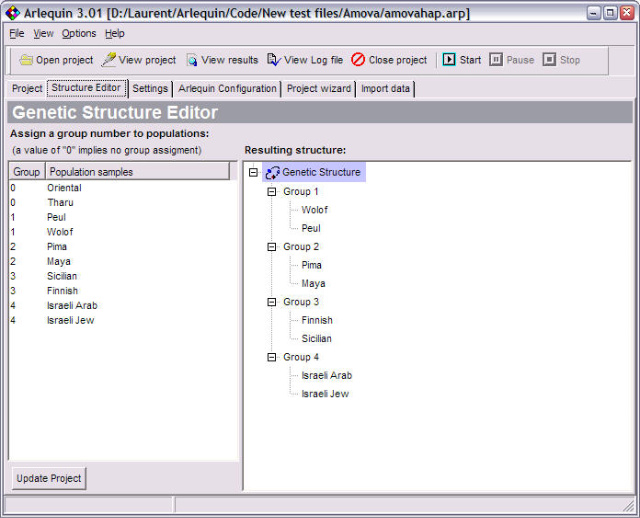
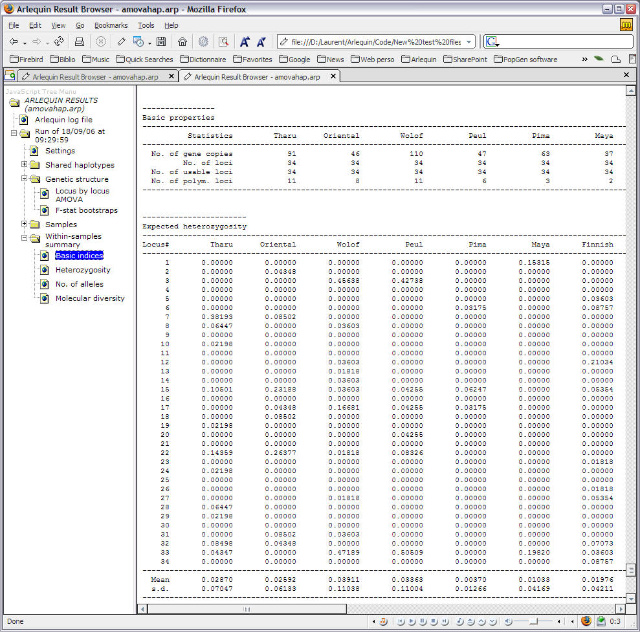
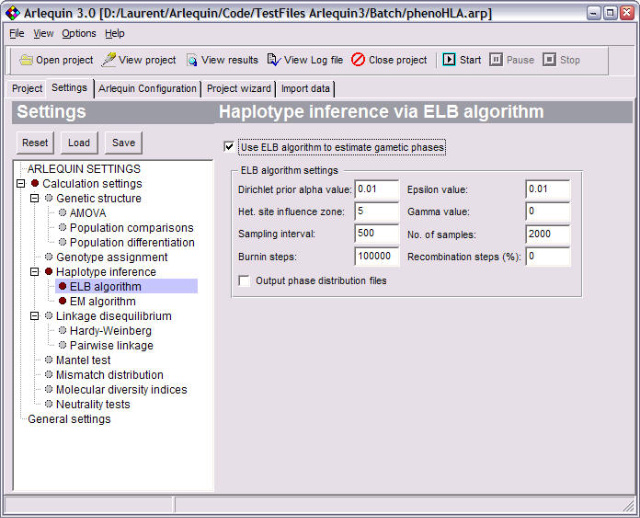
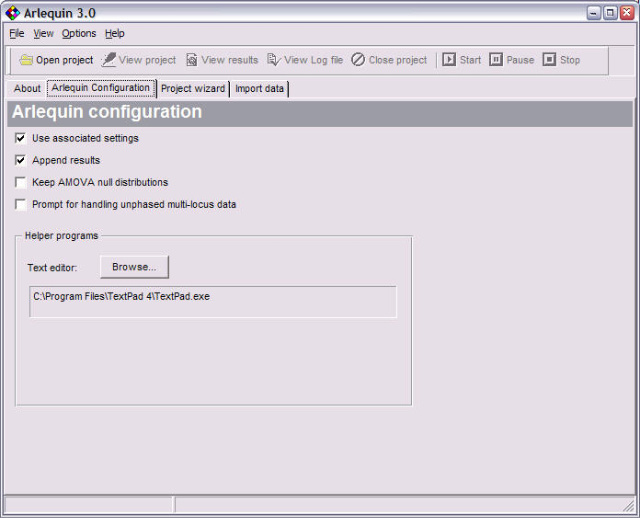
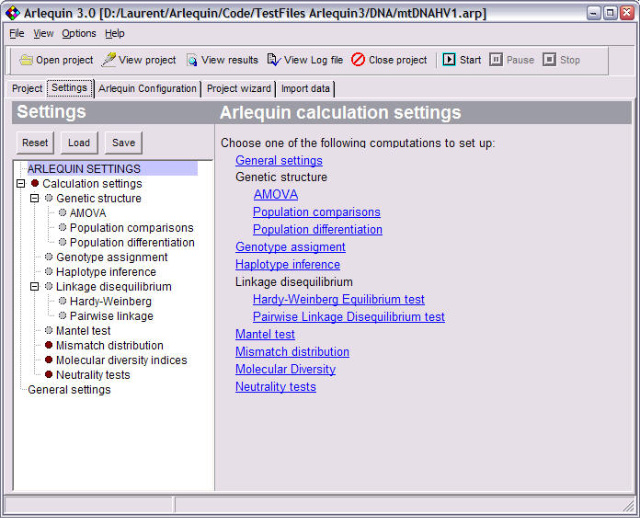
| Population genetics data analysis program - Arlequin v3.11 (0) | 2008.06.25 |
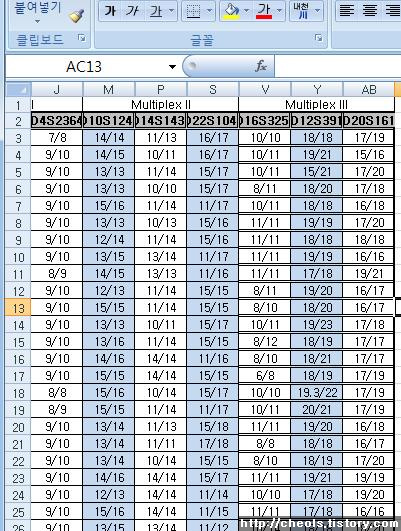
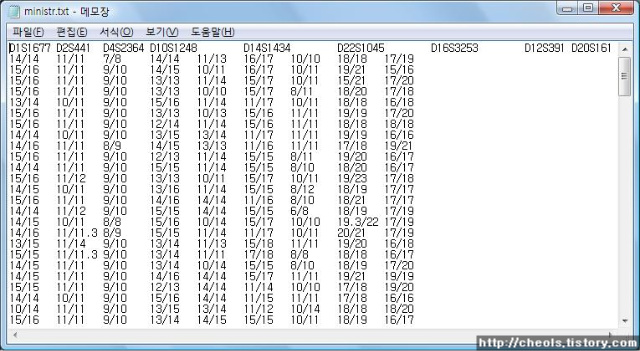
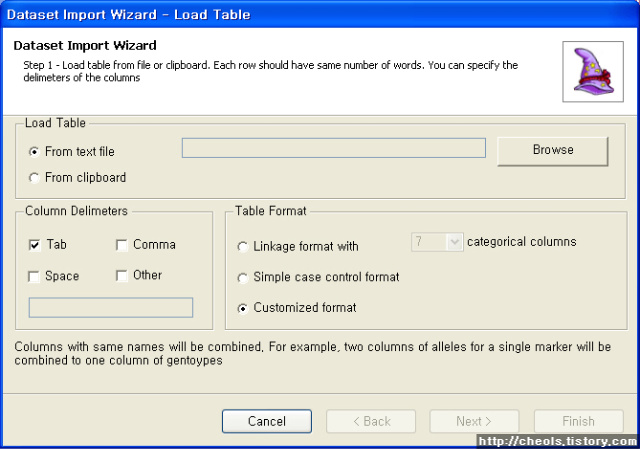
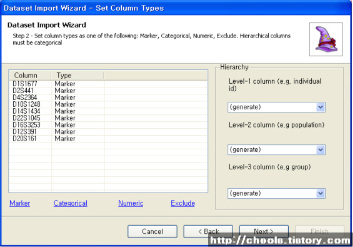
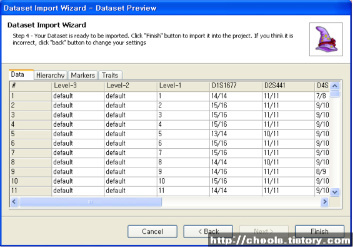
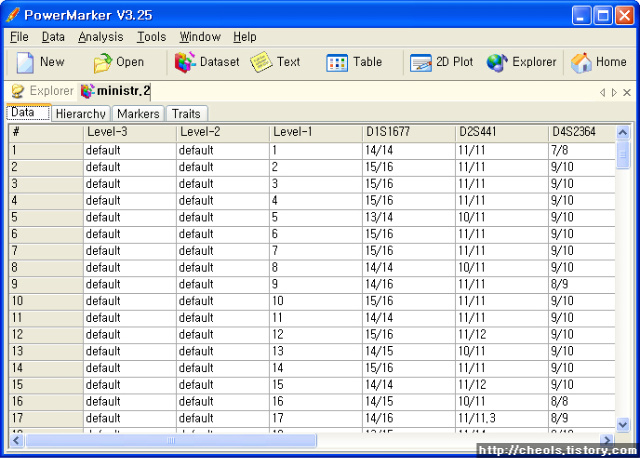
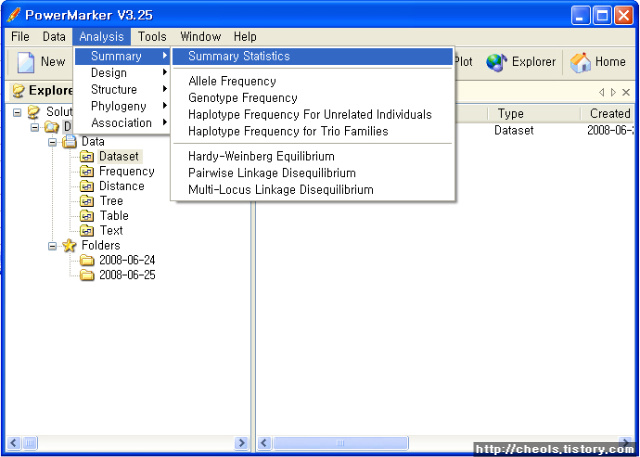
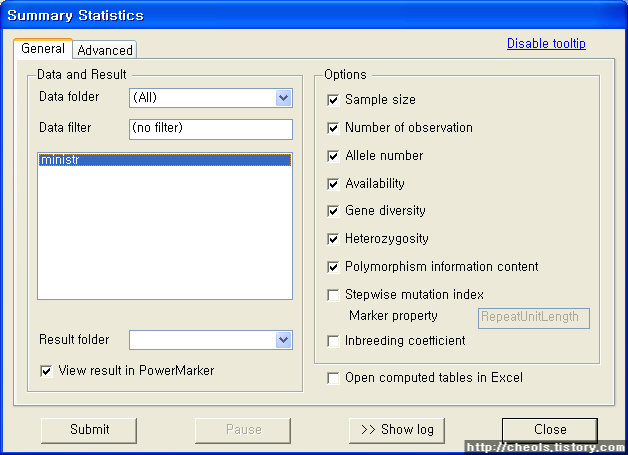
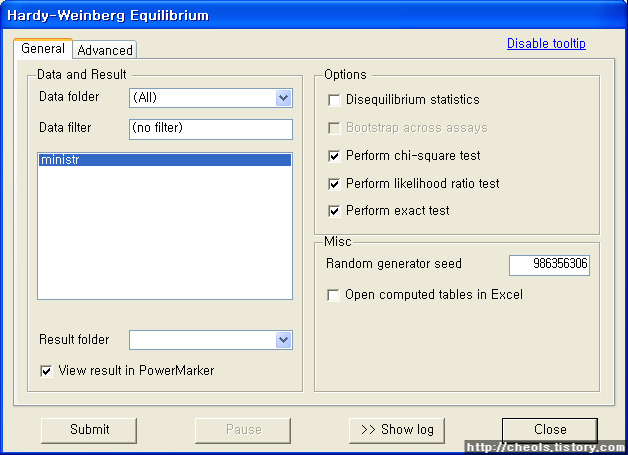
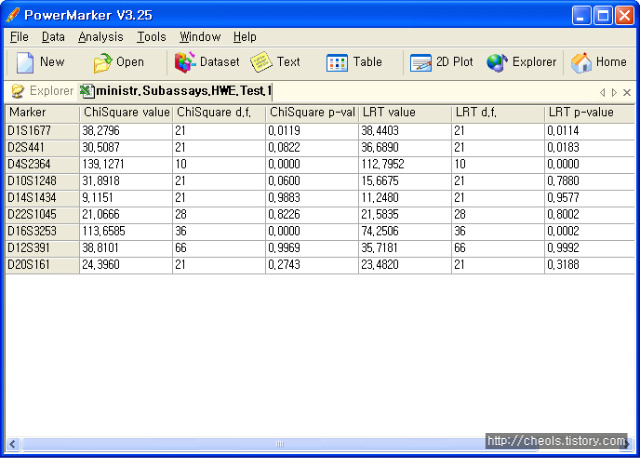
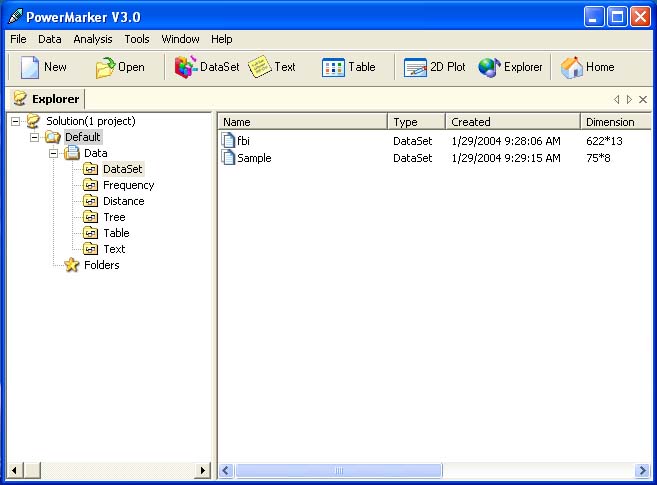
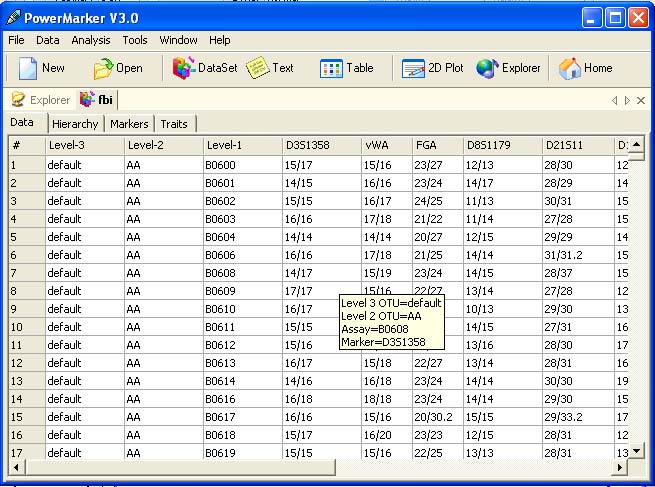
| Powermarker 를 이용한 STR 분석 (0) | 2008.06.25 |
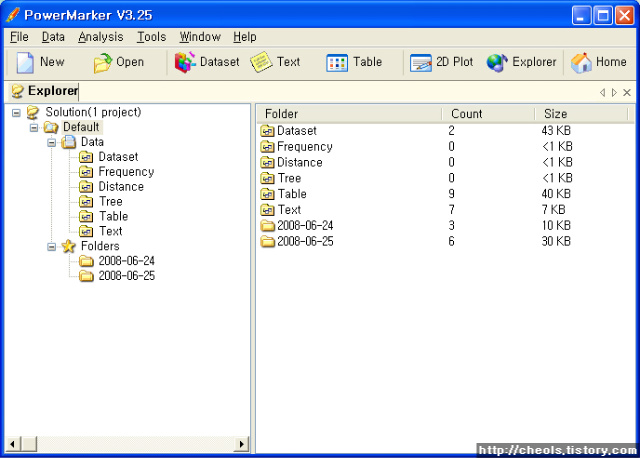
| Population genetics data analysis program - Powermarker v3.25 (0) | 2008.06.25 |